-
3 reasons why gold stocks are cheap
Wed May 29 2024
After three-and-a-half years of going nowhere, gold prices have rallied by US$300 an ounce or around 15% so far this year.
The gold rush has helped local names like Evolution Mining (ASX: EVN), Newmont (ASX: NEM) and Northern Star (ASX: NST) rally a respective 33%, 31% and 12% since March.
While prices have stalled in the past month – gold miners are still trading at relatively attractive valuations under current spot prices. In this piece, we'll explore three reasons why they're still considered 'cheap'.
#1 Upside to forecasts
I've reviewed several analyst reports for gold miners and they've been busy lifting share price targets to reflect higher gold prices. Should prices continue to tick higher, the analysts will likely need to again, lift their assumptions.
On Monday, Citi analysts lifted their target price for Northern Star from $14.50 to $15.20 to reflect the following changes:
- Upgraded 2024 gold price view to US$2,400 an ounce
- Upgraded long-term gold price forecast from US$1,600 an ounce to US$1,850 an ounce
- Updated resources and reserves
- Higher opex forecasts to reflect sticky inflation
Overall, the changes lifted EBITDA forecasts by 6-11% over the next three years, improving from $1.95 billion in FY23 to an estimated $2.75 billion by FY26.
Earlier this month, they said gold could trend as high as US$3,000 an ounce under a bull case scenario, driven by "a combination of alternative-fiat demand, geopolitical hedges, macro overlays on equity and credit portfolios, and financial buying catching up to robust physical demand."
#2 ETF flows and demand
Global physically backed gold ETFs have experienced ten consecutive months of outflows through to March 2024. But the pace of outflows is beginning to slow.
In March, global gold ETFs experienced US$823 million in outflows, far less than February outflows of US$2.9 billion and the average of the past nine months of US$2.4 billion, according to the World Gold Council.
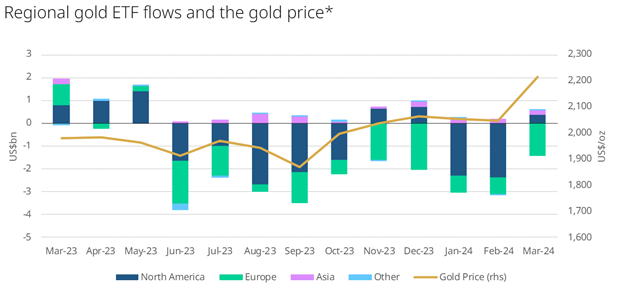
Source: World Gold Council
"Flows in North America flipped back to positive for the first time in 2024. Asia and the Other region also capped inflows. But these were offset by European losses," the report said.
From a gold market trading perspective, the report noted a surge in net longs to 679,000 as of March, up 52% month-on-month or the largest in twelve months. "This was driven by a jump in longs and a plunge in shorts as the gold price surge pushed investors to take part in the action."
#3 Cash flow is coming
Gold miners have had very little to show in the past couple of years and cash flow has been non-existent amid rising costs and hefty capital expenditures.
The US$49 billion market cap Newmont (ASX: NEM) reported a mere US$88 million in free cash flow in 2023, reflecting "unfavourable working capital changes of US$513 million and US$2.7 billion of reinvestment to sustain current operations and advance near-term projects."
Note: The ASX-listed Newmont will have a market cap of $1.15 billion due to the way its CDIs are rebalanced.
But the company's March quarter result demonstrated a glimpse of what's to come under higher gold prices and easing capex (to some extent). Here are some of the key numbers:
- Adjusted income of US$630 million, up 39% quarter-on-quarter and 97% year-on-year
- Adjusted EBITDA of US$1.69 billion, up 22.5% quarter-on-quarter and 71% year-on-year
- Cash outflow of US$74 million, down 75% quarter-on-quarter but up 64% year-on-year
To add some perspective, the adjusted EBITDA of US$1.69 billion was well-ahead of analyst expectations of US$1.40 billion. Newmont guided to full-year capex of US$2.1 billion, down 21% from the US$2.66 billion in the prior year.
Source: https://www.marketindex.com.