
Page 39 - Bullion World Volume 02 Issue 10 October 2022
P. 39
Bullion World | Volume 2 | Issue 10 | October 2022
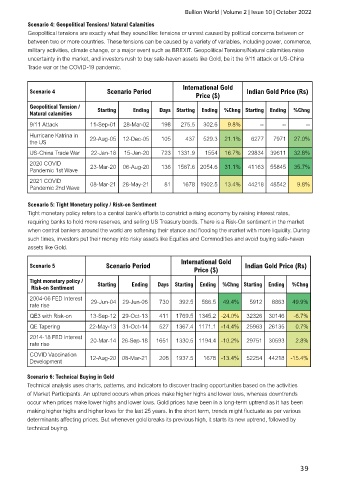
Scenario 4: Geopolitical Tensions/ Natural Calamities
Geopolitical tensions are exactly what they sound like: tensions or unrest caused by political concerns between or
between two or more countries. These tensions can be caused by a variety of variables, including power, commerce,
military activities, climate change, or a major event such as BREXIT. Geopolitical Tensions/Natural calamities raise
uncertainty in the market, and investors rush to buy safe-haven assets like Gold, be it the 9/11 attack or US-China
Trade war or the COVID-19 pandemic.
International Gold
Scenario 4 Scenario Period Indian Gold Price (Rs)
Price ($)
Geopolitical Tension / Starting Ending Days Starting Ending %Chng Starting Ending %Chng
Natural calamities
9/11 Attack 11-Sep-01 28-Mar-02 198 275.5 302.6 9.8% -- -- --
Hurricane Katrina in 29-Aug-05 12-Dec-05 105 437 529.3 21.1% 6277 7971 27.0%
the US
US-China Trade War 22-Jan-18 15-Jan-20 723 1331.9 1554 16.7% 29834 39611 32.8%
2020 COVID 23-Mar-20 06-Aug-20 136 1567.6 2054.6 31.1% 41163 55845 35.7%
Pandemic 1st Wave
2021 COVID 08-Mar-21 28-May-21 81 1678 1902.5 13.4% 44218 48542 9.8%
Pandemic 2nd Wave
Scenario 5: Tight Monetary policy / Risk-on Sentiment
Tight monetary policy refers to a central bank's efforts to constrict a rising economy by raising interest rates,
requiring banks to hold more reserves, and selling US Treasury bonds. There is a Risk-On sentiment in the market
when central bankers around the world are softening their stance and flooding the market with more liquidity. During
such times, investors put their money into risky assets like Equities and Commodities and avoid buying safe-haven
assets like Gold.
International Gold
Scenario 5 Scenario Period Indian Gold Price (Rs)
Price ($)
Tight monetary policy / Starting Ending Days Starting Ending %Chng Starting Ending %Chng
Risk-on Sentiment
2004-06 FED Interest 29-Jun-04 29-Jun-06 730 392.5 586.5 49.4% 5912 8863 49.9%
rate rise
QE3 with Risk-on 13-Sep-12 29-Oct-13 411 1769.5 1345.2 -24.0% 32326 30146 -6.7%
QE Tapering 22-May-13 31-Oct-14 527 1367.4 1171.1 -14.4% 25963 26135 0.7%
2014-18 FED Interest 20-Mar-14 26-Sep-18 1651 1330.5 1194.4 -10.2% 29751 30593 2.8%
rate rise
COVID Vaccination 12-Aug-20 08-Mar-21 208 1937.5 1678 -13.4% 52254 44218 -15.4%
Development
Scenario 6: Technical Buying in Gold
Technical analysis uses charts, patterns, and indicators to discover trading opportunities based on the activities
of Market Participants. An uptrend occurs when prices make higher highs and lower lows, whereas downtrends
occur when prices make lower highs and lower lows. Gold prices have been in a long-term uptrend as it has been
making higher highs and higher lows for the last 25 years. In the short term, trends might fluctuate as per various
determinants affecting prices. But whenever gold breaks its previous high, it starts its new uptrend, followed by
technical buying.
39