LBMA Precious Metals Market Volumes: Turnover Figures for July 2023
Welcome to our monthly round-up of the LBMA OTC trading volumes in gold, silver, platinum and palladium, as recorded on a daily basis by the Association. These are split into spot, swap/forward, options and LoanLeaseDeposit (LLD) and give a flavor of the markets’ activity and how they were influenced by external forces and news items.
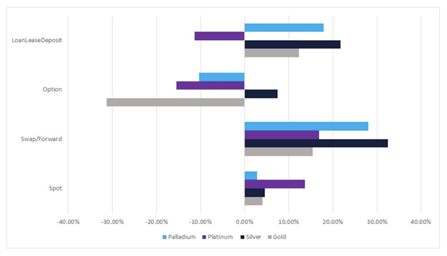
As the chart above shows, volumes were generally better in July than in the previous twelve months, with the exception of most options and platinum LLD. The picture was pretty uniform across the board, with all four metals trading in narrow ranges, gaining ground in the first half of the month and then going into reverse. It will be no surprise that the dollar, as the arbiter of many areas of risk and economic forces, was a key driver. All metals ended July in positive territory, with silver up 8%, platinum and palladium narrowly mixed around +4% and gold up just 2%. The dollar was ever so slightly lower, losing just over 1%, so the metals were showing some degree of independent strength, although this was not carried through into the first days of August.
The first part of the month saw the dollar under some pressure on the back of, among other things, weaker employment numbers than expected and talk of just one more rate hike this year (that has changed slightly since); then, in the second half, U.S. mentality was colored by high consumer spending and inflation figures, which changed the tone and the dollar traded accordingly, but didn’t strengthen enough to unwind the weakness of the first half.
Daily July average compared with daily average for the 12 months to June 2022
Source: LBMA
GOLD
Spot gold volumes - July (tonnes)
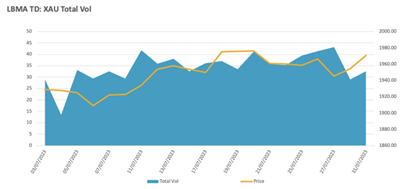
Source: LBMA
At the end of July and in early August, the financial markets are working on the basis that there will be no more rate hikes from the Fed, but FOMC members are not all of that view by any means.
Initially, in July, gold edged higher off the back of support between $1,900 and $1,920 (anecdotal evidence suggesting central bank interest at these levels), took a hit to the downside on 5th July in response to robust Purchasing Managers numbers, but then rallied smartly on the nonfarm payroll numbers, which missed the markets’ expectations. Up to this point, two more rate hikes had been priced into the market, but this started to change, with increasing talk that July would be the final rate increase from the Fed this year.
This theme continued to run through the markets until the end of the third week of July when mildly disappointing retail sales numbers gave gold a boost towards $1,985. There was no follow-through, however, and gold started to drift lower thereafter.
Gold: The key technicals and the inverted dollar

Source: Bloomberg, StoneX
Trading was relatively muted in all four sectors during this mildly bullish phase, although interest picked up in spot and forwards on the 11th-13th as technical factors kicked in to help boost the upward move that was already underway. Initially, gold crossed above the ten-day moving average, then crossed the twenty-day to the upside, both of which triggered technical action in spot and also generated interest in the forwards at $1,940 and $1,960. Options activity also kicked in at this level and hit 2M ounces on 11&12th combined, as gold approached $1,960; taken with the big jump in forward activity, this suggests sizeable hedging activity, especially as prices failed at that point, generating a small correction.
The final burst of upward action after this correction, with the test of $1,985, was again triggered by U.S. economic numbers; in this instance, a shortfall in retail sales, which saw a jump in spot trading but nothing in the other OTC instruments, rather suggesting that the pricing at $1,960 had taken up most of the interested market stakeholders’ firepower.
The same could not be said of LLD activity. This had been largely quiet up to that point but sprang to life on and after the test of $1,985. The LLD volumes going through on that and the following four trading days averaged 1.8M ounces per day against 1.2M daily in the 12 months to June 2023 and 1.0M ounces per day in July up to that stage. This implies lively borrowing activity, which could have come from either side of the market but may well relate to supply-side financing.
The drift lower to the end of the month was accompanied, as expected, by the Fed’s 25-basis point hike in the fed funds target rate. While Jay Powell’s prepared statement to the Press Conference had dropped the reference made in June that “As I noted earlier, nearly all Committee participants expect that it will be appropriate to raise interest rates somewhat further by the end of the year,” in his Press Conference he understandably kept open the Fed’s room for maneuver. In response to questions, he noted that the FOMC is still looking for more data on the broader picture, although most elements look to be going in the right direction due to restrictive policy – but also that it has “not been restrictive enough for long enough to have its full desired effects.”
This left the jury out about a September hike, with some Committee members still vowing that there is more to be done. As we write this in early August, the fed funds futures are assuming that there will be no more hikes, which suggests that buoyancy in U.S. rates will come from continued Quantitative Tightening.
Meanwhile, in the background, the markets were keeping a close eye on China — not so much from the point of view of geopolitical tensions (although Russia and China did carry out a four-day military exercise in the Japan Sea in mid-month, which caught some attention but no disruption); of more interest was the trajectory of the yuan given the underwhelming economic numbers from China, and what the People’s Bank was planning to do about it. Later in the month and into August, there were moves to support the currency, which could have undermined gold on a broad basis since it appears that as part of this exercise, gold import quotas were not being issued (although that of itself boosted domestic premia, this is more of an August story). Weak China PMI at the end of the month further undermined local demand.
The international pull on physical gold from China was, therefore, muted during July, as it was in much of the price-elastic regions as the markets remained cautious.
Gold ETFs remained under light pressure over July, and while attrition was light, it was there nonetheless, reflecting a lack of interest but also affecting overall sentiment to some extent, given that those numbers are reported on a daily basis, even if not every fund is captured on the headlines.
Over the month, there were only seven days of creations; the rest were all redemptions for a reduction of just seven tonnes over the month.
On COMEX, Managed Money outright long positions increased through to mid-month and then reversed as prices hit $1,985, leaving them virtually unchanged over July. Shorts covered positions as prices rose, but here, too, the $1,985 level was a key and short-side traders expanded positions thereafter, leaving the net long at 249t, against 217t in late June and a high of 359t on 18th July.
So an interesting month, even though the price ranges were narrow. After positive signs of life in the first half, there was insufficient interest or bullish background triggers to clear $1,985, and with no real change thereafter, prices drifted lower to bring the $1,900-$1,920 range back into the crosshairs in early August.
SILVER
Spot silver volumes - July (tonnes)

Source: LBMA
Gold and silver followed similar trends over July, and the patterns of trading volumes were also similar. Silver was very quiet during the gentle upward movement at the start of July, knocking against $23, correcting in line with gold, slightly livelier for a few days as the uptrend re-established itself after the correction and then increasing volumes as gold moved up towards $1,965 and silver bounded up from $23 to $25 in the space of three days.
At this point, with gold moving from $1,935 to $1,964, a gain of 1.8%, silver put on 8.4% to challenge $25; when gold topped out at $1,985, silver reversed. Gold’s downward trend was not mirrored by silver, however, as this metal eked out an almost horizontal pattern until just before month-end. After trying to consolidate above $24, in the end, the support was not strong enough, and silver dropped 4% in a day from $25.25 to $24 and then finished the month at $24.75 before unraveling in the first days of August.
The difference here is not that uncommon. On many occasions, if gold appears to be non-committal, silver will look to its industrial nature. Bear in mind that 60% of global silver demand is in the industrial sector. The “precious” connotation goes back hundreds of years to when it was legal tender in a number of countries and extended by its use in jewelry and decorative wear. This seems to have been the case in later July, with silver taking its positive cue from the stronger economic signals in the United States that were keeping a cap on gold, while there also some elements of cautious optimism about the potential for recovery in China, especially the growing manufacturing activity in the solar cell sector. Ultimately, though, China’s numbers were of increasing concern, and the metal ultimately joined in gold’s retreat.
As noted above, spot volumes were at their peak in mid-month as silver rallied hard towards $25; some of this would have been technically driven with the election of stops, along with algorithms and commodity timing advisor activity. This was paralleled in the swaps/forwards sector, with an average daily volume of 163M ounces (5,070t) against an average for the month (ex-those days) of 104M ounces or 3,244tpd. Given the amount of mined metal that is a by-product of either lead-zinc copper or gold, it is highly likely that some miners were locking in attractive by-product credits. There was some option activity as silver nosed over $25, suggesting some hedging against the downside, while in the LLD sector, the only day of note was on 24th July with a huge jump to 35.9M ounces (1,117t) against a month average (without that day ) of 10.3M ounces (320t). This was the final day of the short-lived downward trend after the failure at $25 and suggested that sentiment was changing as fresh buying met more selling. There was no specific trigger for this, but it could have been mixed positioning ahead of the Fed statement and press conference a couple of days later. The fact that the price started moving higher could suggest that this was industrial buying interest.
Gold, silver, the correlation and the ratio, year-to-date

Source: Bloomberg, StoneX
Among the silver ETFs, there were only eight days of creations during July for a net loss over the month of 5606t, although against a base of just over 23,200t, this is really neither here nor there. As with gold, though, it does point to a market that is unprepared to commit either way, and as the concentration of sales was in mid-month, this points to some degree of readiness to take profits.
The CFTC numbers traced a similar pattern to those of gold, with logs rising in the first half and then being trimmed, for a net gain of 2,393t to 7,166t. Shorts were mixed, but on balance, they too increased by 995t to 5,131t. This left the net position at 2,035t, but probably of more significance is that the outright long at month-end was 15% higher than the twelve-month average, suggesting a speculative overhang but not an unmanageable one.
PLATINUM
Platinum’s price pattern in July was also largely in line with the inverted changes in the dollar, and prices were steady to start with, then rising over much of the first half and easing in the second half, putting in a couple of spectacular moves along the way. While the dollar was important, the platinum market also has other more fundamental elements to contend with, notably the continued uncertainty over the supply of power into the South African mining sector in the face of Eskom’s load-shedding program; and the vicissitudes of the automotive and jewelry sectors in the background.
Prices typically traded in $15 ranges or more, which off a base of $900, is not that volatile. After opening July at $906 and ranging initially up to $921, we then saw a drop to just blow $900. Arguably this was related to the Chinese economy, in which the price numbers released early in the month suggested that the economy was moving into deflation. China’s program of tightening emission control standards, especially with heavy-duty or diesel vehicles, has been extended to the end of the year, and this is a key to industrial platinum demand. While the program itself continues unabated, anything that points to reduced purchasing in that country is likely to have an effect on metal market sentiment. Platinum is essential in diesel after-treatment, and Western trade statistics, along with anecdotal evidence, have suggested that China had been a major buyer over the past few years but exported some metal in the first few months of 2023. Any suggestion of further economic weakening could spook the markets into expecting more supply from that region. And this may well, therefore, have affected sentiment.
Spot platinum volumes - July (tonnes)

Source: LBMA
Thereafter, with bargain hunting appearing around the lows, prices worked their way towards a test of $1,000, including a two-day move that saw a gain of 7% in price and which tied in with the dollar’s weakness as U.S. inflation numbers came in well below expectations, hitting both the dollar and Treasury yields. Here, too, the rally was built on sand rather than firm ground, and platinum ran out of steam in mid-month with a high of $996.
Trading in early July was interesting in that spot volumes were at their strongest into the rally, suggesting some bargain hunting and perhaps some follow-through or even some technical trading as spot cleared the ten and then the 20-day moving averages. It also looks as if this was joined in the latter part of the rally (but not at the end of it) by some lively forwards, LLD and options activity. Given that the South African producers are guarding against the possibility (and at the moment, it looks like a possibility rather than a probability) of smelting disruptions due to load-shedding, forward selling from that source looks unlikely, but there could well have been some borrowing in the market against possible disruptions and possibly even some forward buying. Because of the amount of borrowing that has to go on in the platinum market on behalf of companies that use platinum as in-process material (e.g., glass producers, petrochemical refiners, catalytic cracking, etc.), it is hard to distinguish what is coming from the supply side and what from demand on the basis of the numbers alone.
Spot platinum and the dollar, year-to-date

Source: Bloomberg, StoneX
The second half of July was much quieter. There were a couple of days that were relatively busy in the forwards, when on one day, it looked as if there was some forward selling into an upward correction during a down-draft in an effort to catch some value, and then again right at month-end as platinum slid down through $950.
Meanwhile, in South Africa, Eskom appears to be weathering the winter relatively well at the moment, but there is always a risk of reaching Stage Six. At that point, despite a degree of ring-fencing, miners may well find themselves required to cut power usage by up to 15%, and this would affect downstream activities. This was highlighted in early August by Impala’s results, which we shall go over in next month’s report. If Eskom has to reach Stage Eight, then underground mining activity could be affected, but at the moment, that looks like a remote possibility.
The ETF activity in July was not much better than gold and silver, with only eight days of creation for a net loss of 1.2t, or 1.3% of the total. Activity on NYMEX was more interesting, with a big increase in outright longs in the first half as sentiment improved; these then stabilized so that the overall gain was 6.0t or 17%, while shorts contracted by 4.0t or 13%, leaving a net long of 5.1t at month-end.
PALLADIUM
Palladium spot volumes - July (tonnes)

Source: LBMA
Palladium continues to struggle in the face of long-term adversity as the march toward net zero and vehicle electrification moves ever onward. Even if the major 2030 and 2040 targets are not met (and there are always headwinds for a major change such as this), then the fact that there are – at present - no scaleable uses for palladium in electric vehicles will leave a gaping hole in its supply-demand balance from around the turn of the decade. Remember that the auto sector (before we think about recycled material) accounts for over 80% of palladium demand, and if these optimistic targets are met, then by 2040, the auto sector will be a net supplier of palladium into the market, not a major consumer. The scrapped autocats sector is already the second largest producer of refined palladium, although when and if South Africa’s problems are resolved, then it may be nudged –if only temporarily - into third place.
These long-term portents have been having an increasing effect on market sentiment, and palladium continued to struggle. At the start of August, palladium prices had fallen by 34% since the start of this year and by 56% from the peak of March 2021 (not counting the spike in early 2022). Since then, there has been a burst of fresh activity for a challenge of $1,300; more of this will be in next month’s review.
The trading patterns: palladium traded in just a 4% range in July, and that range was established in the second week of the month. It is possible that this was a period of consolidation ahead of the fresh life in August. In July, however, palladium opened at $1,235 and drifted sideways with its peers in the sector, but when after it had failed several times at $1,260, all four OTC sectors kicked in to help prompt a sharp fall to below $1,200 - and an equally sharp recovery on the same day, to get back to $1,240.
The rally that followed, which also was bang in line with the slippage in the dollar, was in the highest spot volume of the month, and some light forward interest, took palladium to a high of $1,329. One point of note over the month was that there were some tentative signs of interest from the auto sector as palladium drifted lower in the latter part of July, and this is almost certainly reflected in a few days of livelier forward and LLD activity as spot prices came off. In the exchange-traded products, palladium had an even more torrid time than the other metals, with just four days of creations in July and 17 days of redemptions for a net loss of 0.45t or 3%, to a nine-week low.
On NYMEX, the CFTC position is another record short. During July, the outright long Managed Money position increased substantially as bargain hunters appeared, rising by 35% or .26t to 10.1t. Shorts, however, expanded by 9.4t or 33% to 37.7t, leaving the net at 27.5t, the largest since the CFTC began reporting in this format in 2009. This leaves palladium in a very interesting position, vulnerable to stale bull liquidation in one set of circumstances or liable to a sharp short-covering rally should the elements turn for the better.
Platinum, palladium and the correlation

Source: Bloomberg, StoneX
As we write, it looks as if the tailwinds have the upper hand; we now need to wait and see whether the early August rally meets fresh selling.
Source: https://www.nasdaq.com/